Data
The Data keyword is used for building charts by providing the data manually. The following is an example.
Example
data:: [Month, Mood]
Month:: [ Jan, Feb, Mar, Apr, May, June, July, Aug, Sept, Oct, Nov, Dec]
Mood:: [12,11,10,9,8,7,6,5,4,3,2,1]

obj.scales.x.type = category
obj.plugins.legend.display = true

data(2026):: [Month, CrazyEvents]
CrazyEvents:: [3,6,7,9,12,14,4,20,21,20,4,29]

obj.plugins.title.text = Using data::
This block of code generates this plot.
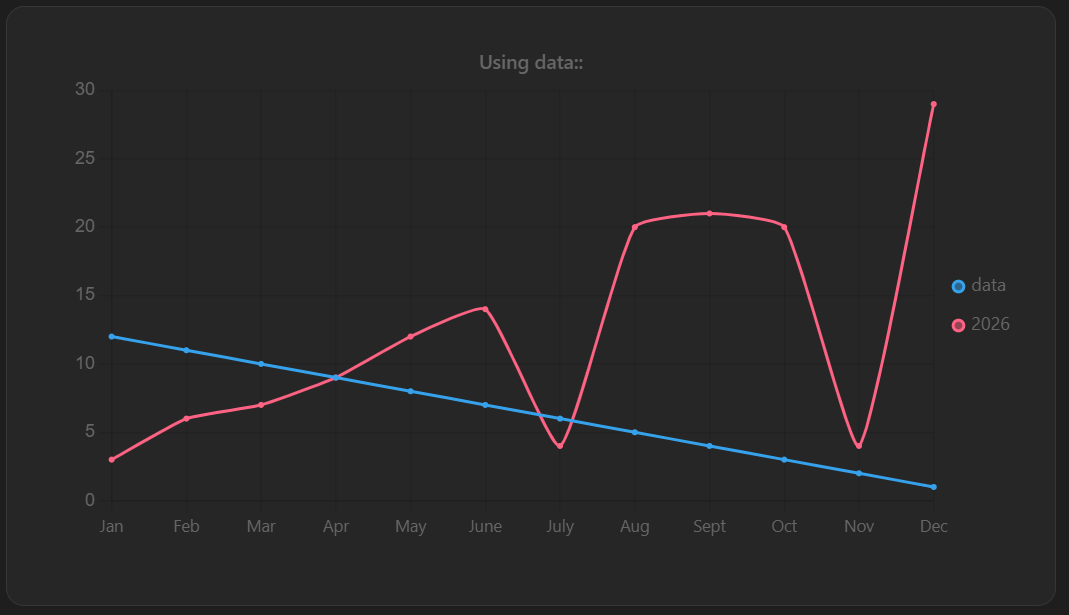
Notice that the :: is required to indicate that the line is a data line. You can name the data using the name in data(name). In this example the obj.scales.x.type = category line is required since the x axis is not numerical.